Finance · iPhone & iPad
The market,
at a glance.
Real-time quotes, interactive heatmap, advanced charts, and powerful portfolio management — everything a serious investor needs, in one app.
Real-time quotes, interactive heatmap, advanced charts, and powerful portfolio management — everything a serious investor needs, in one app.
Built for serious investors. Every feature is purposeful, every screen is fast, and the data is always live.
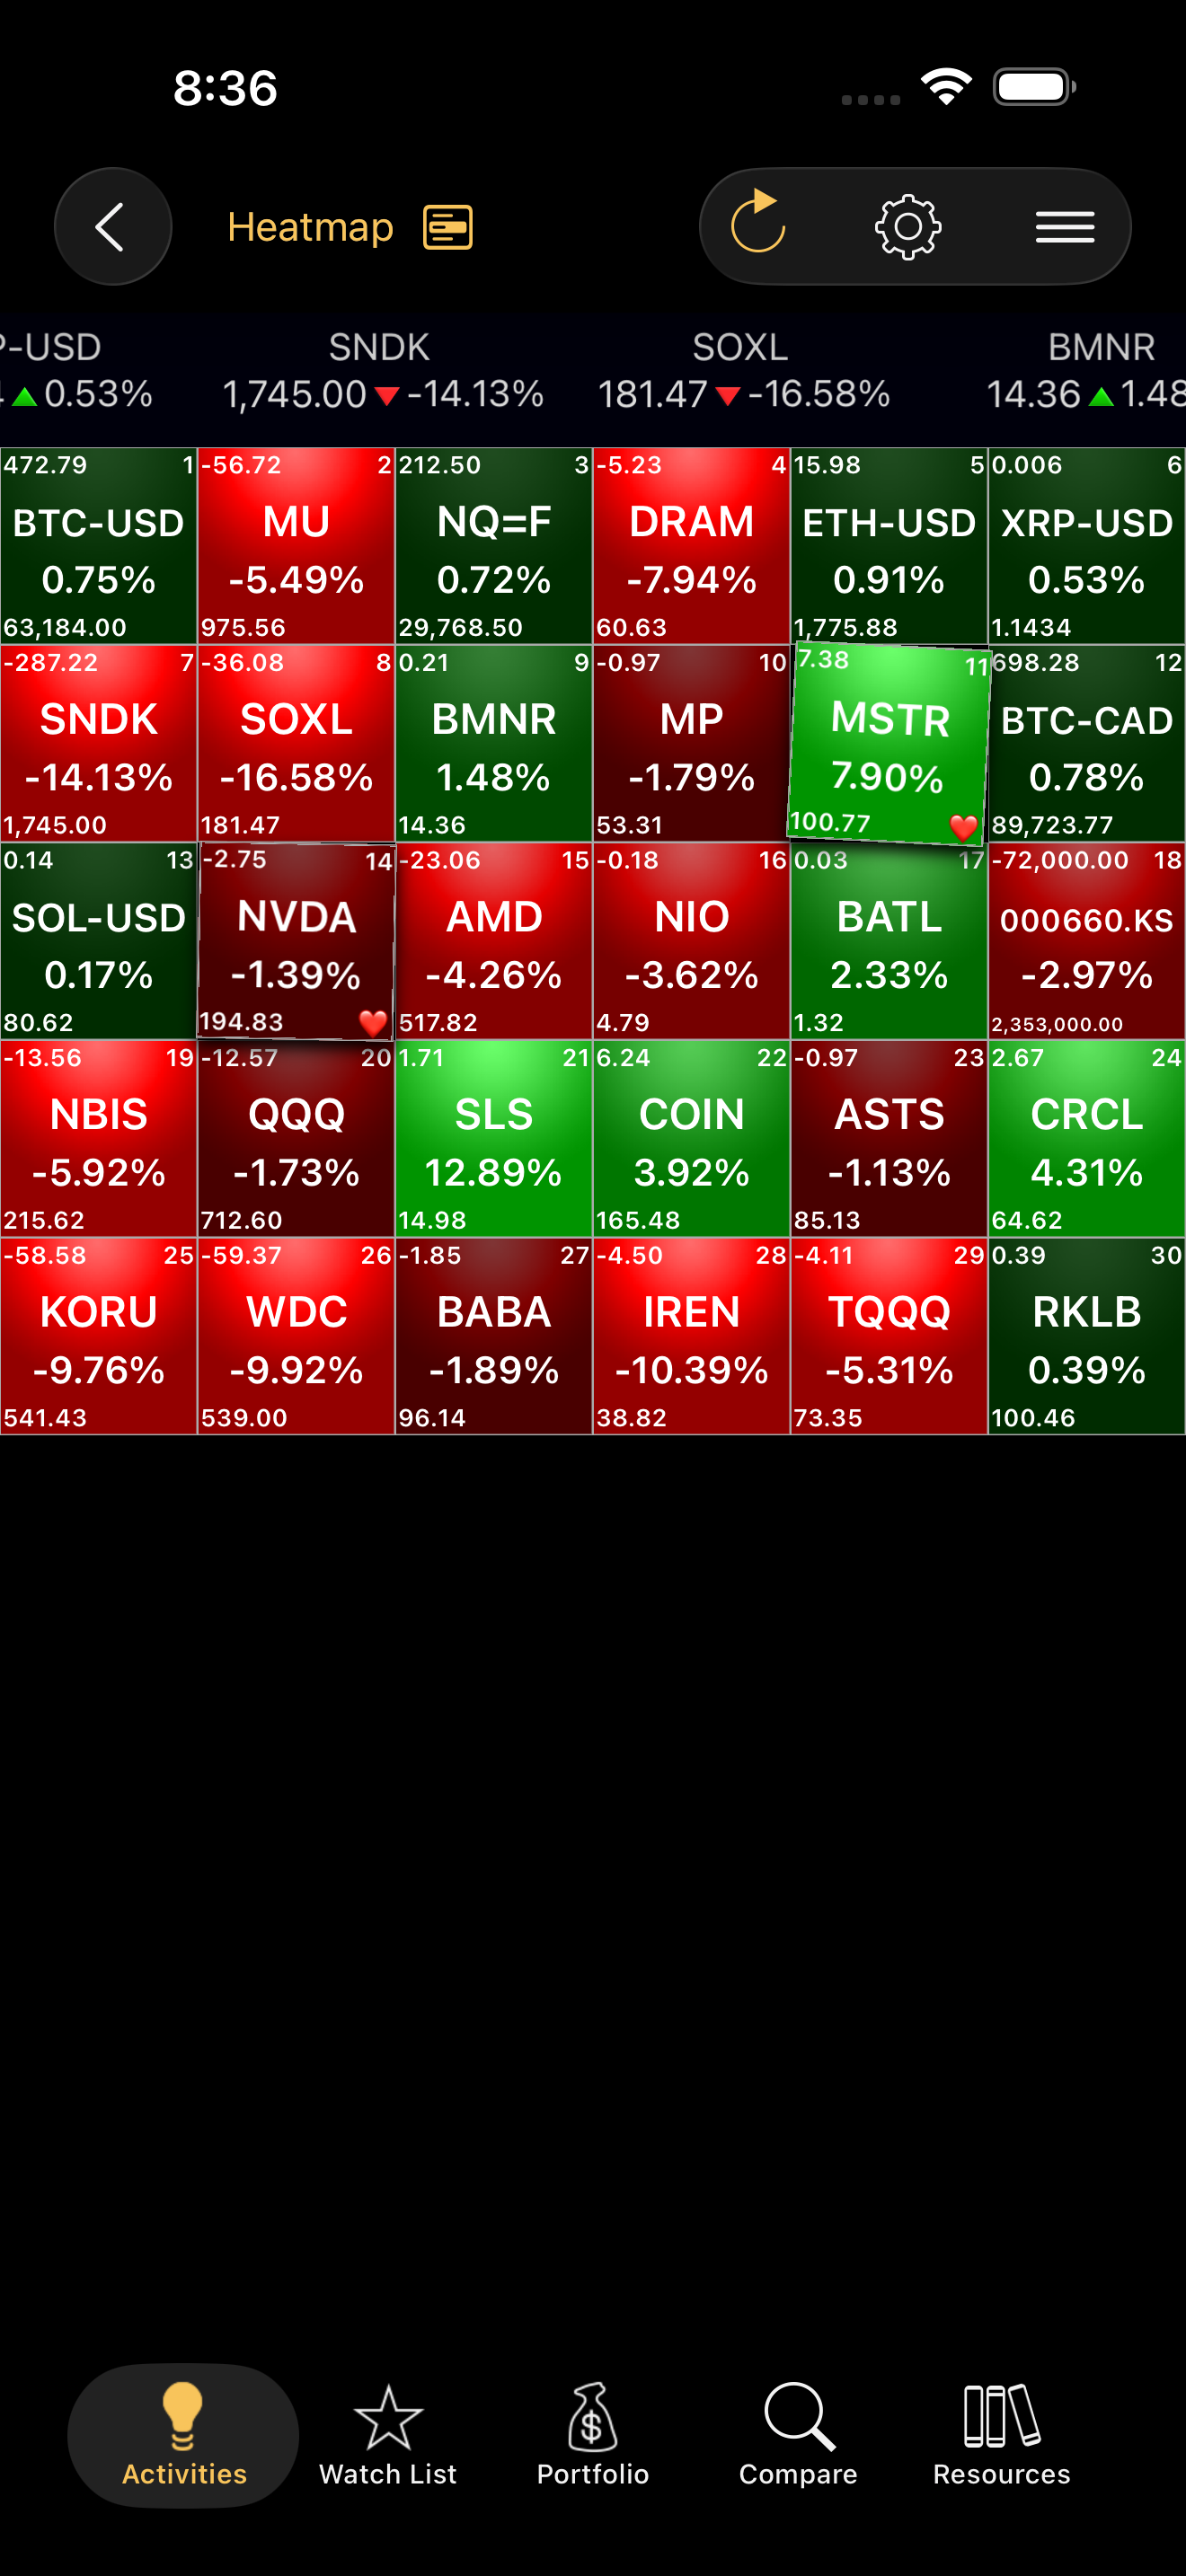
Instantly visualize the entire market in a color-coded grid. Spot sector movers, identify trends, and find opportunities in seconds.
Live quotes across US, international, and crypto markets. Bids, spreads, volume, 52-week ranges, and market cap — always up to the second.
Multiple chart styles, beautiful themes, and full technical analysis. Compare stocks side by side across any timeframe from 1 day to max history.
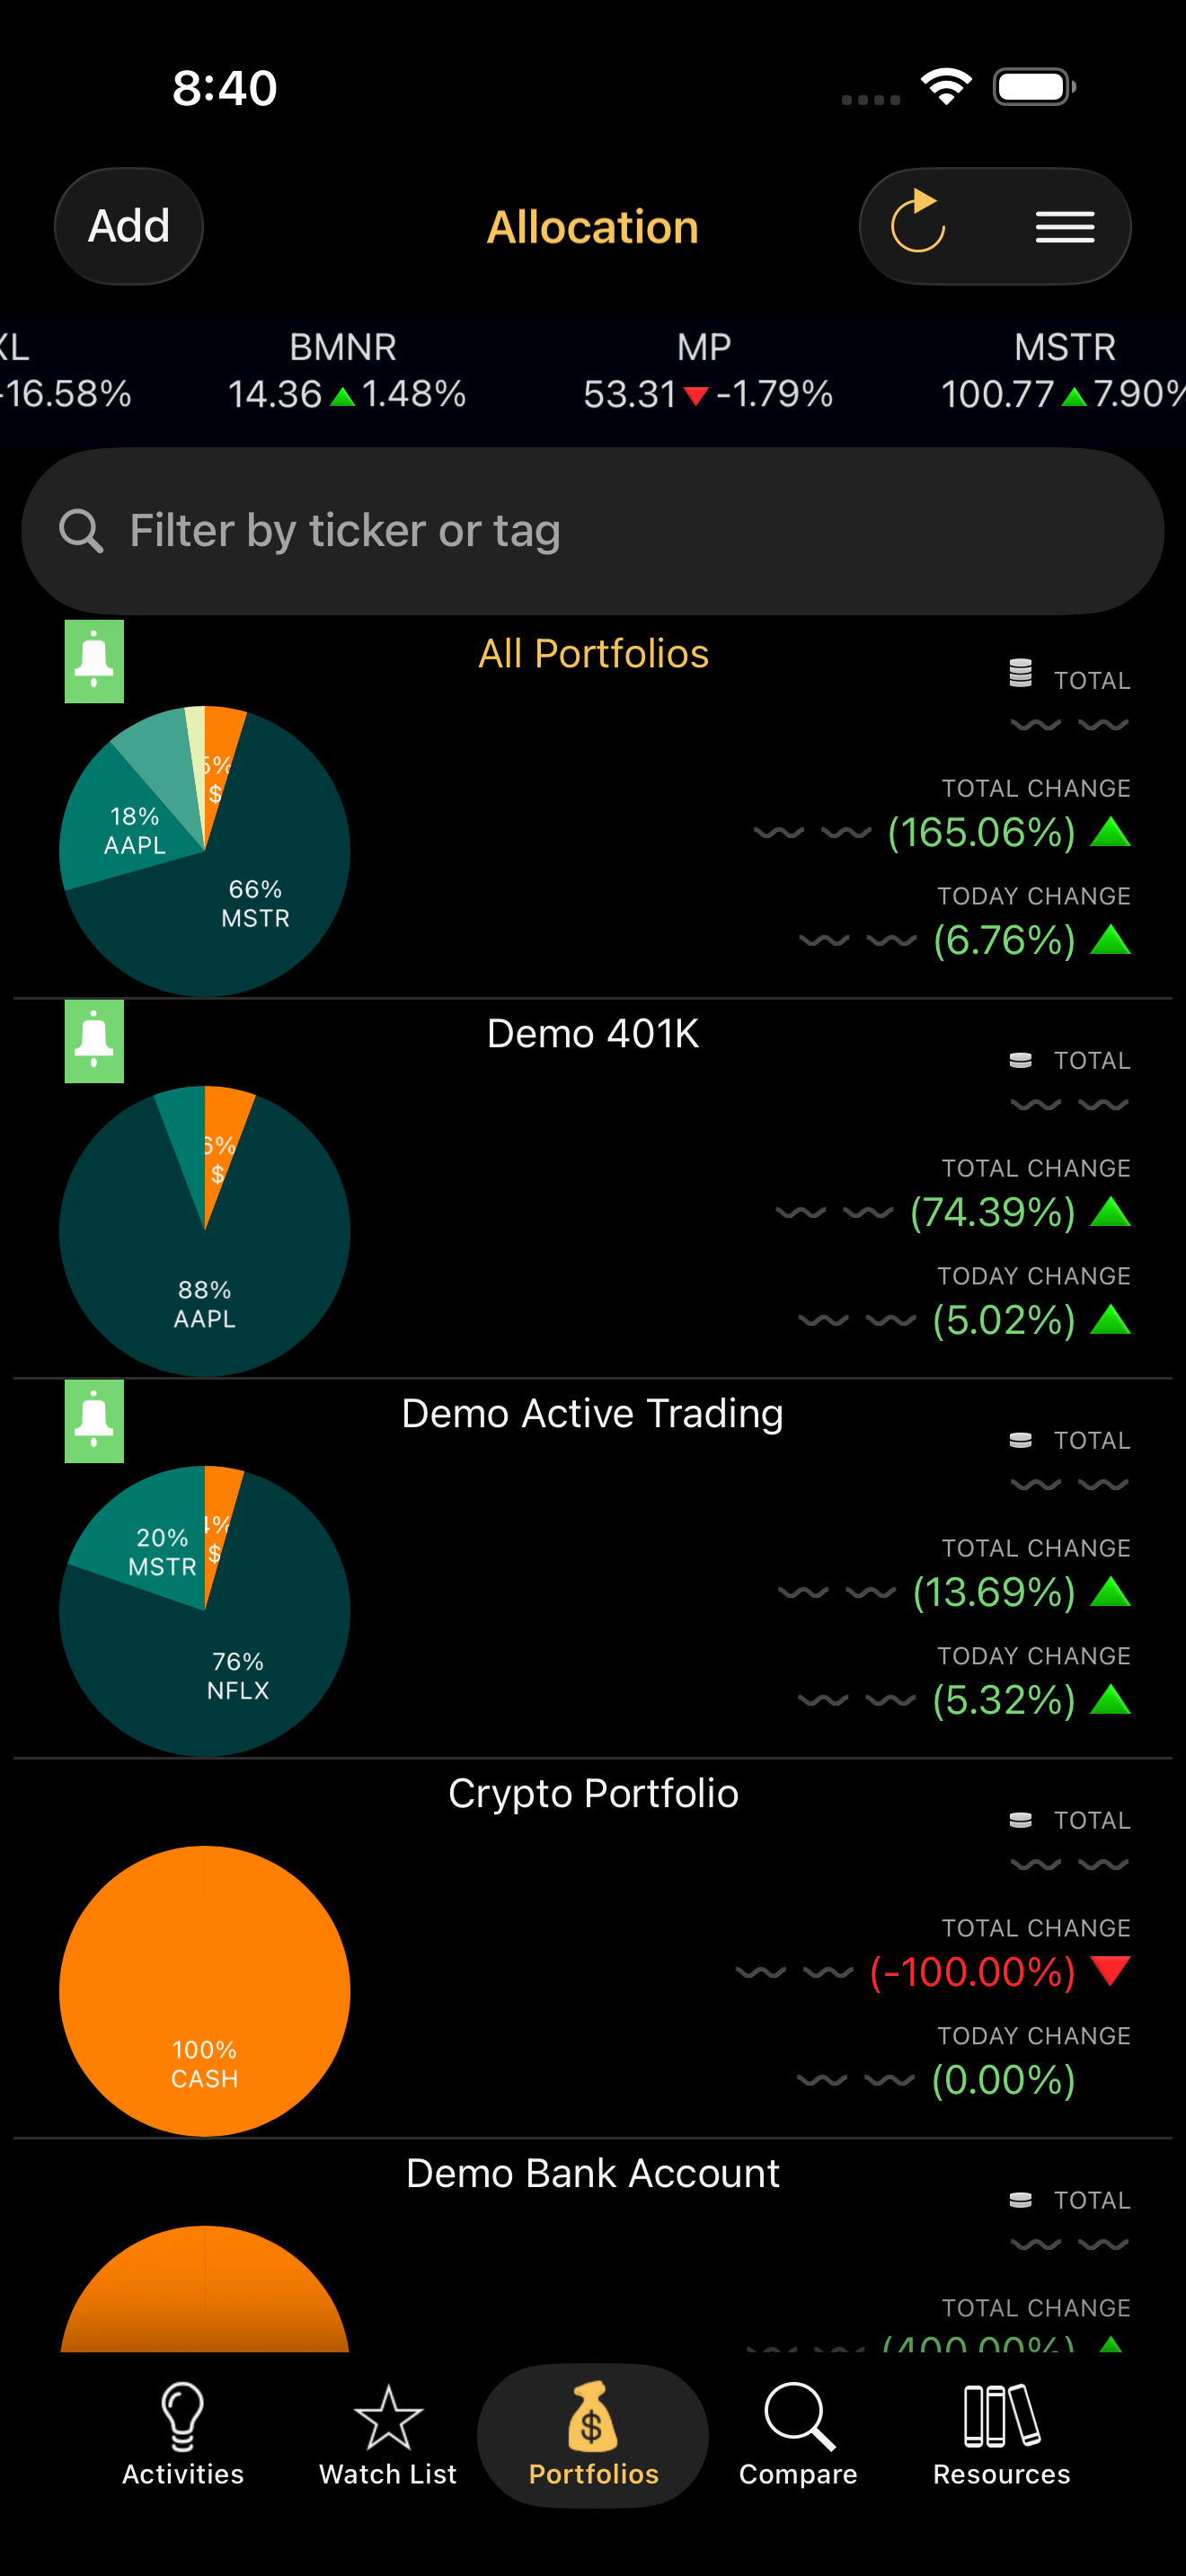
Track multiple portfolios with real-time P&L, allocation pie charts, custom tags, and total values in any currency — all in one view.
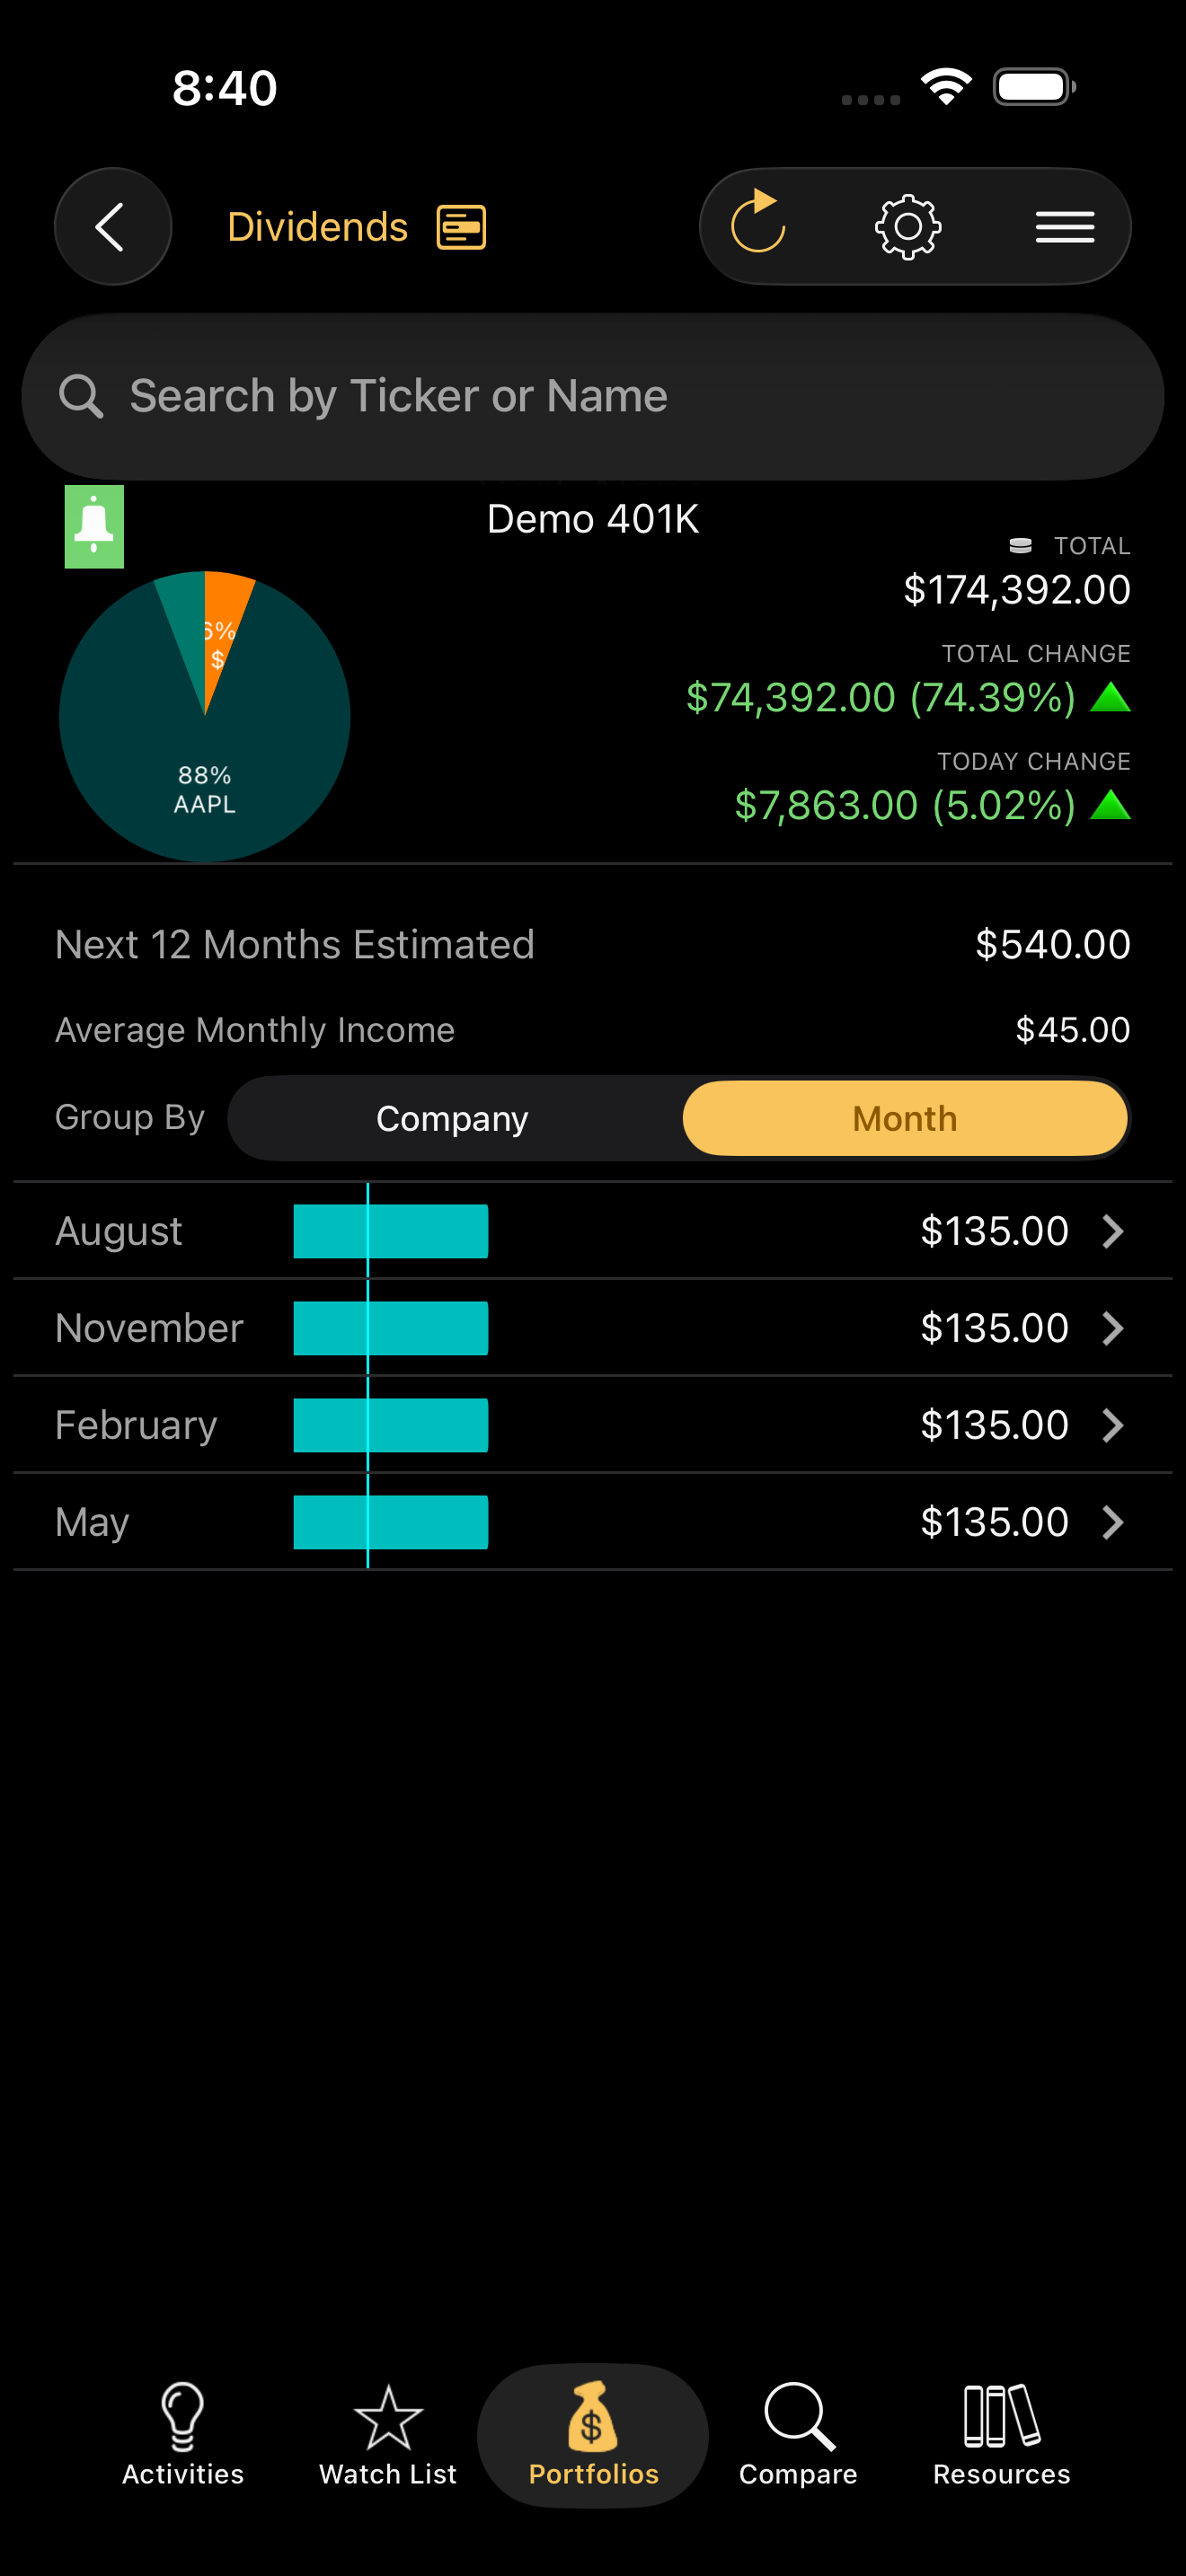
Plan your passive income with a 12-month dividend forecast from your holdings. See projected monthly payouts grouped by company or date.
Discover winners with comprehensive scanners covering bullish and bearish patterns across technical and fundamental indicators in all markets.
From heatmap to dividends — explore the depth of Stocks Live in every view.
Heatmap
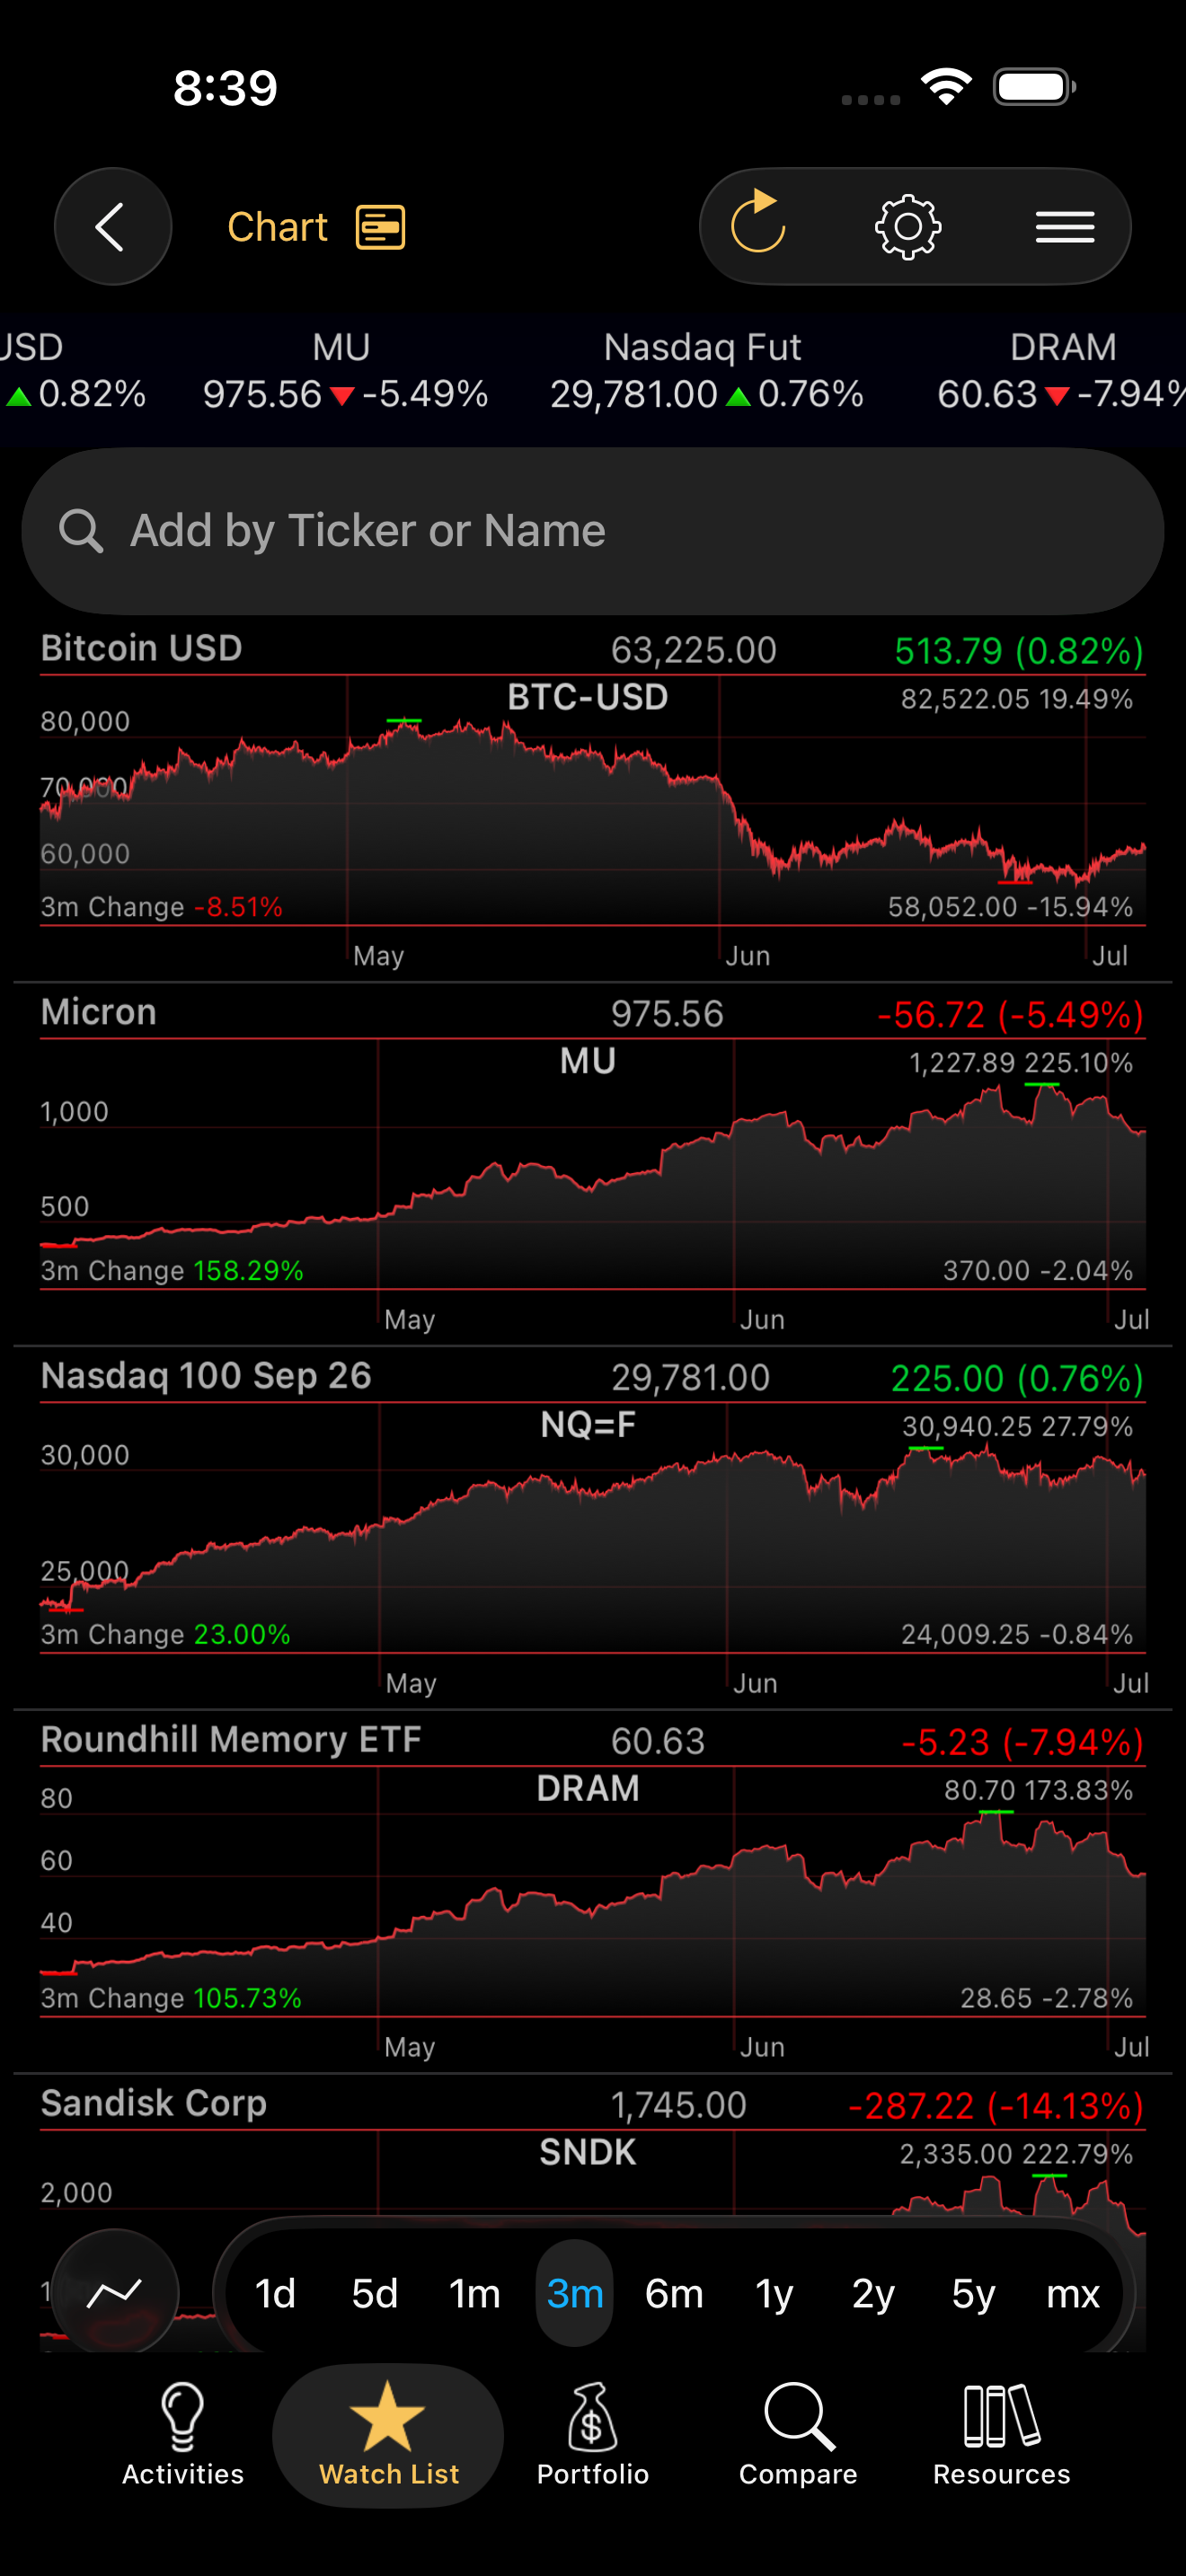
Charts
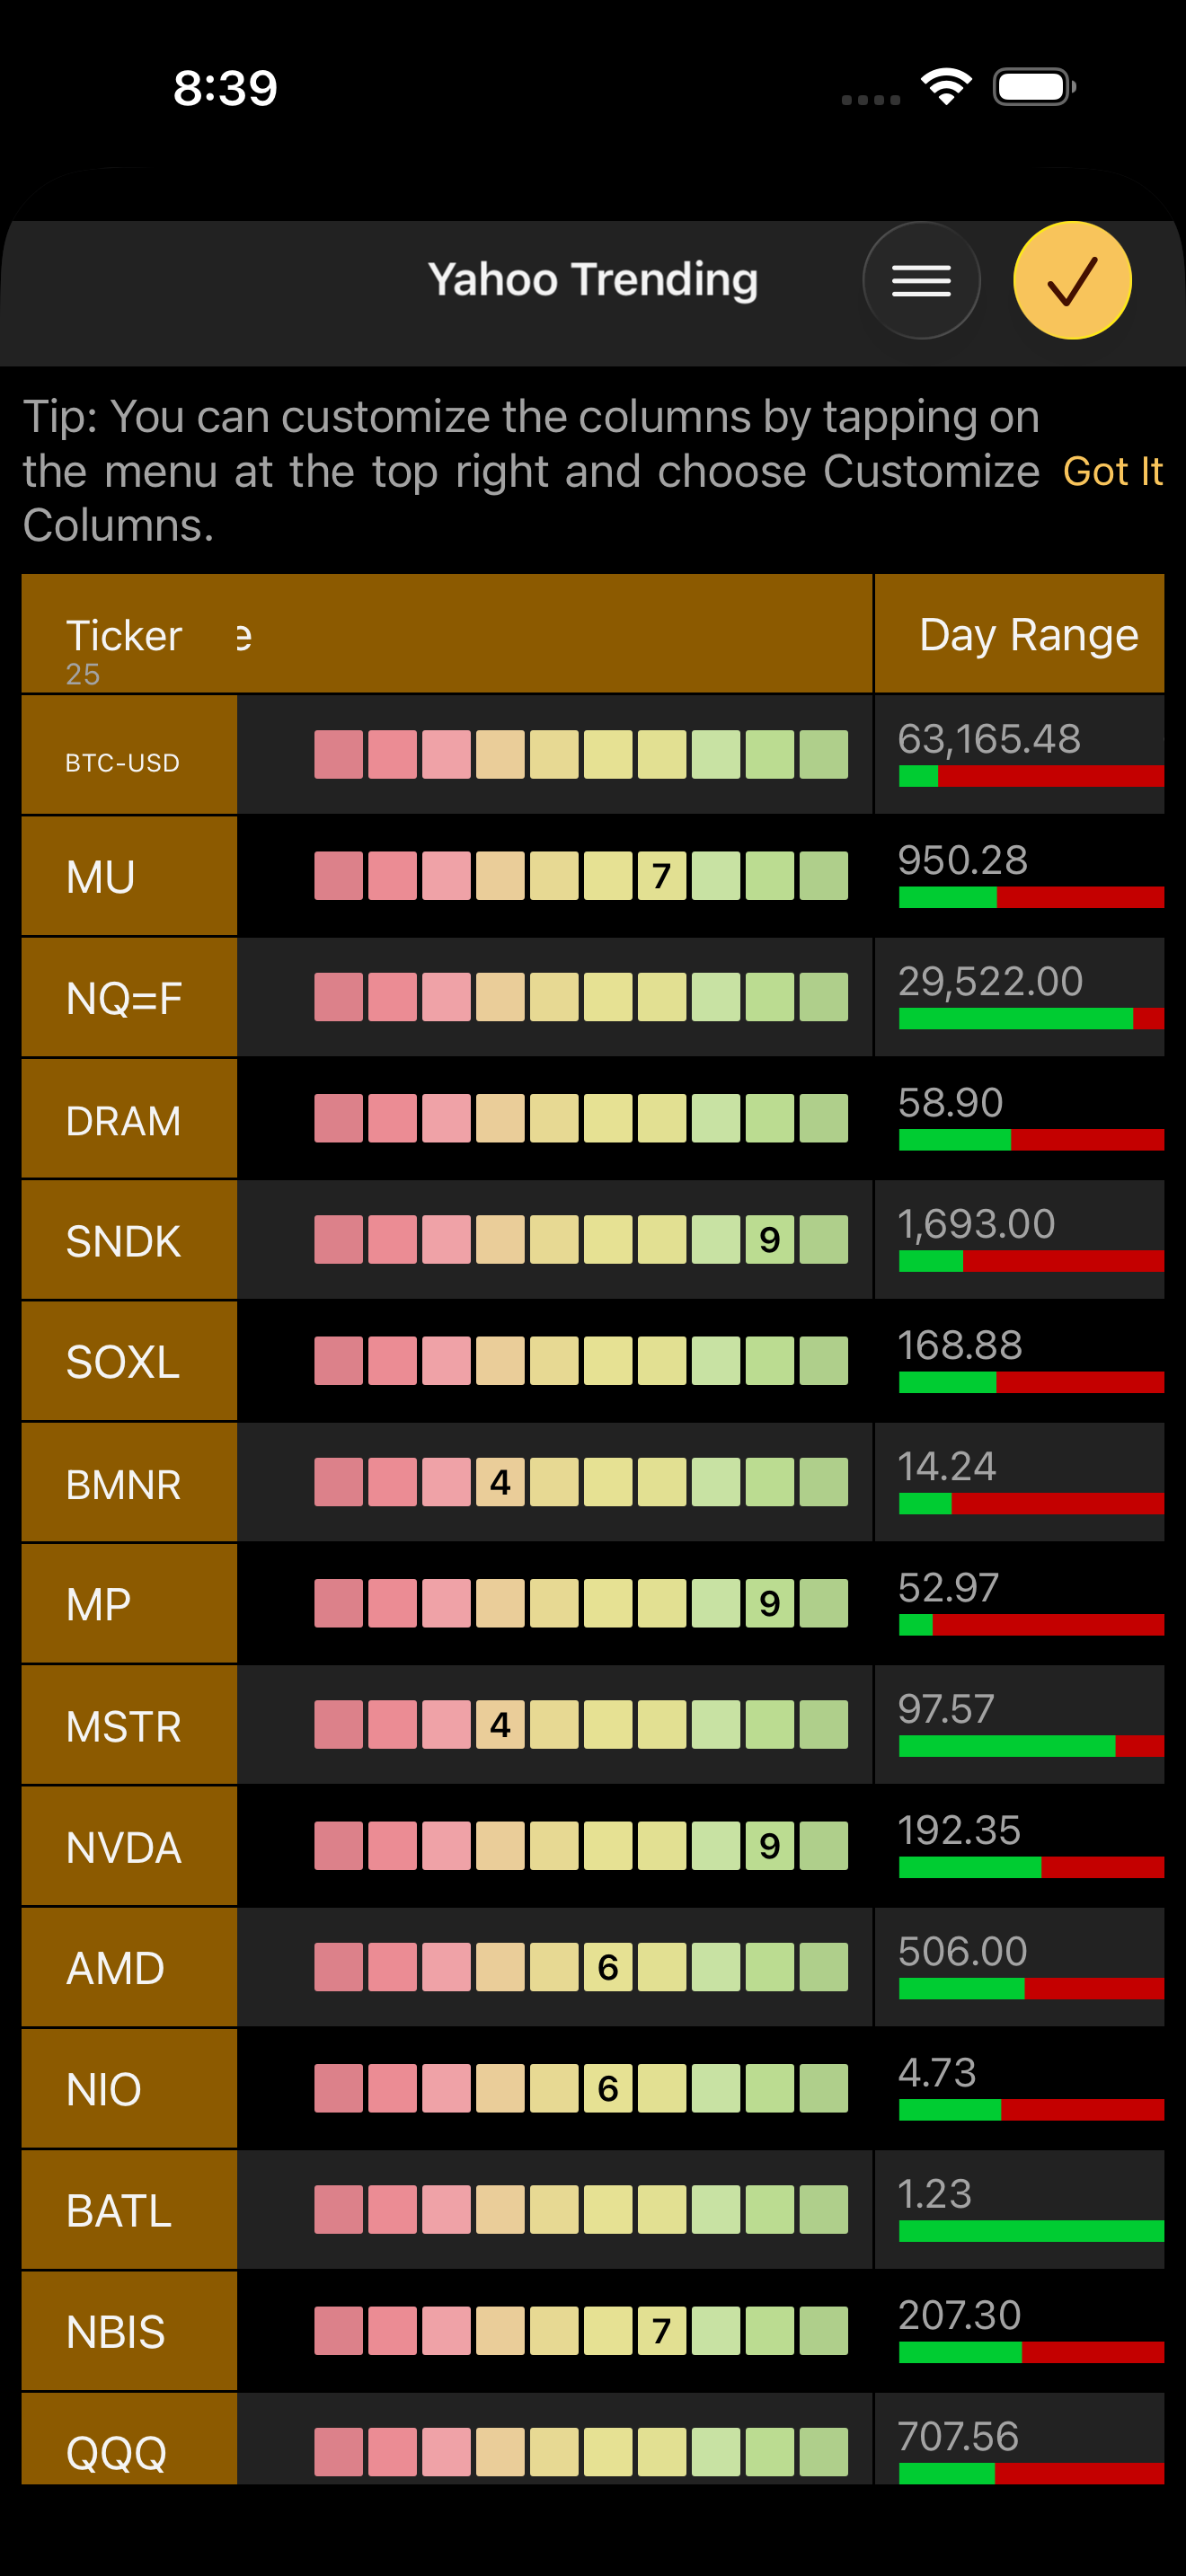
Watchlists
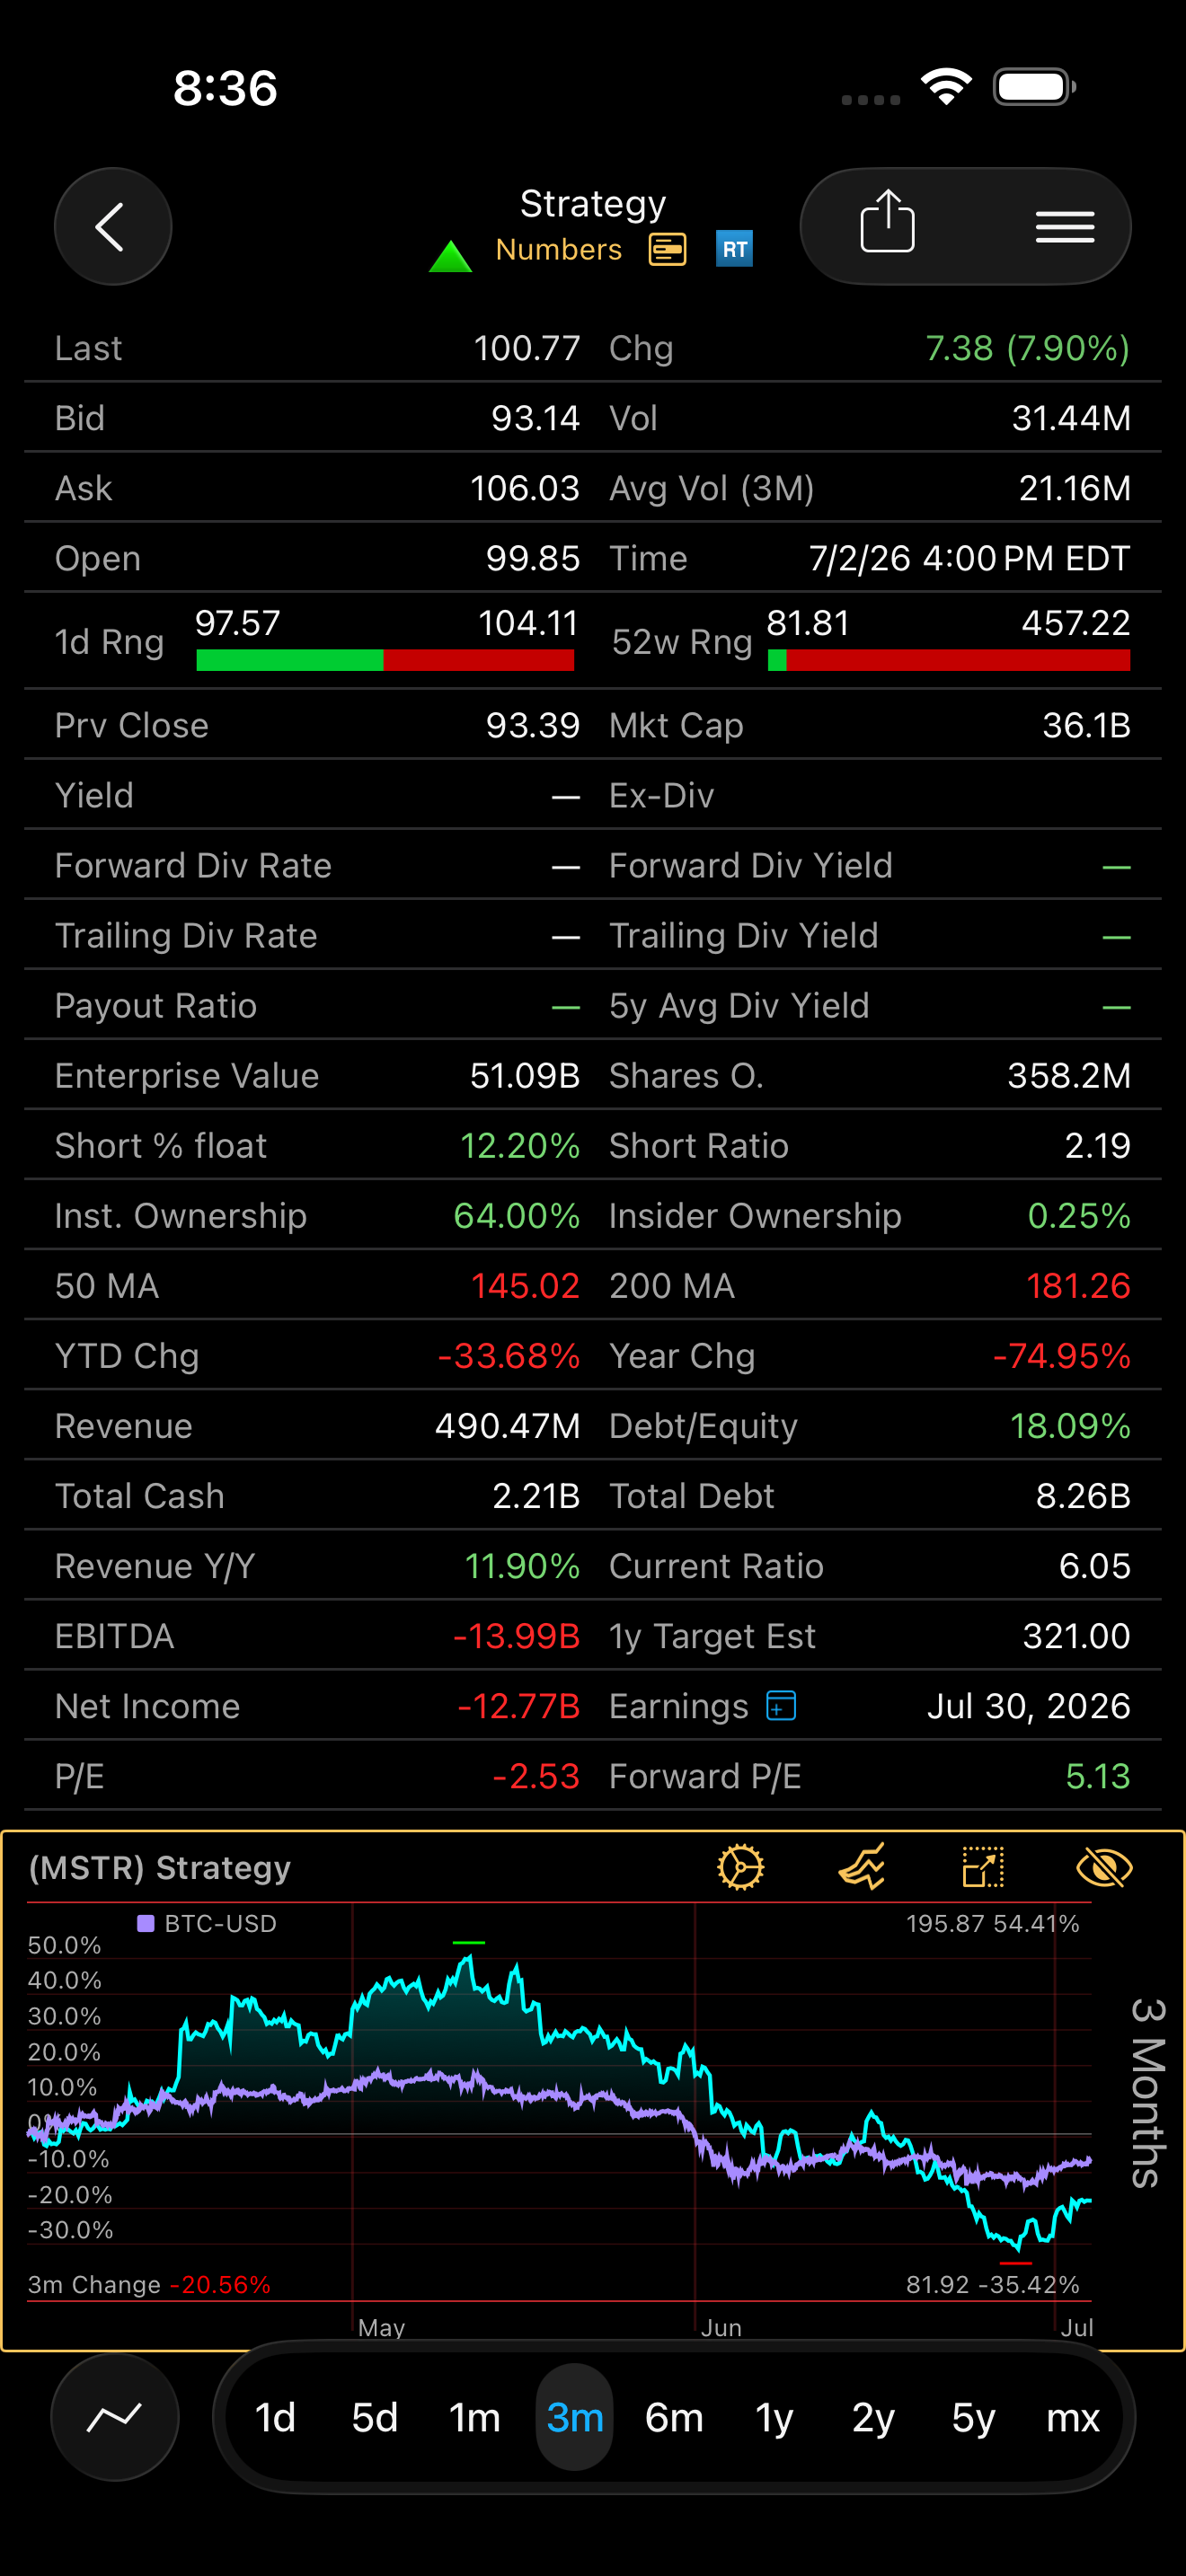
Research
Portfolios
P&L
Dividends
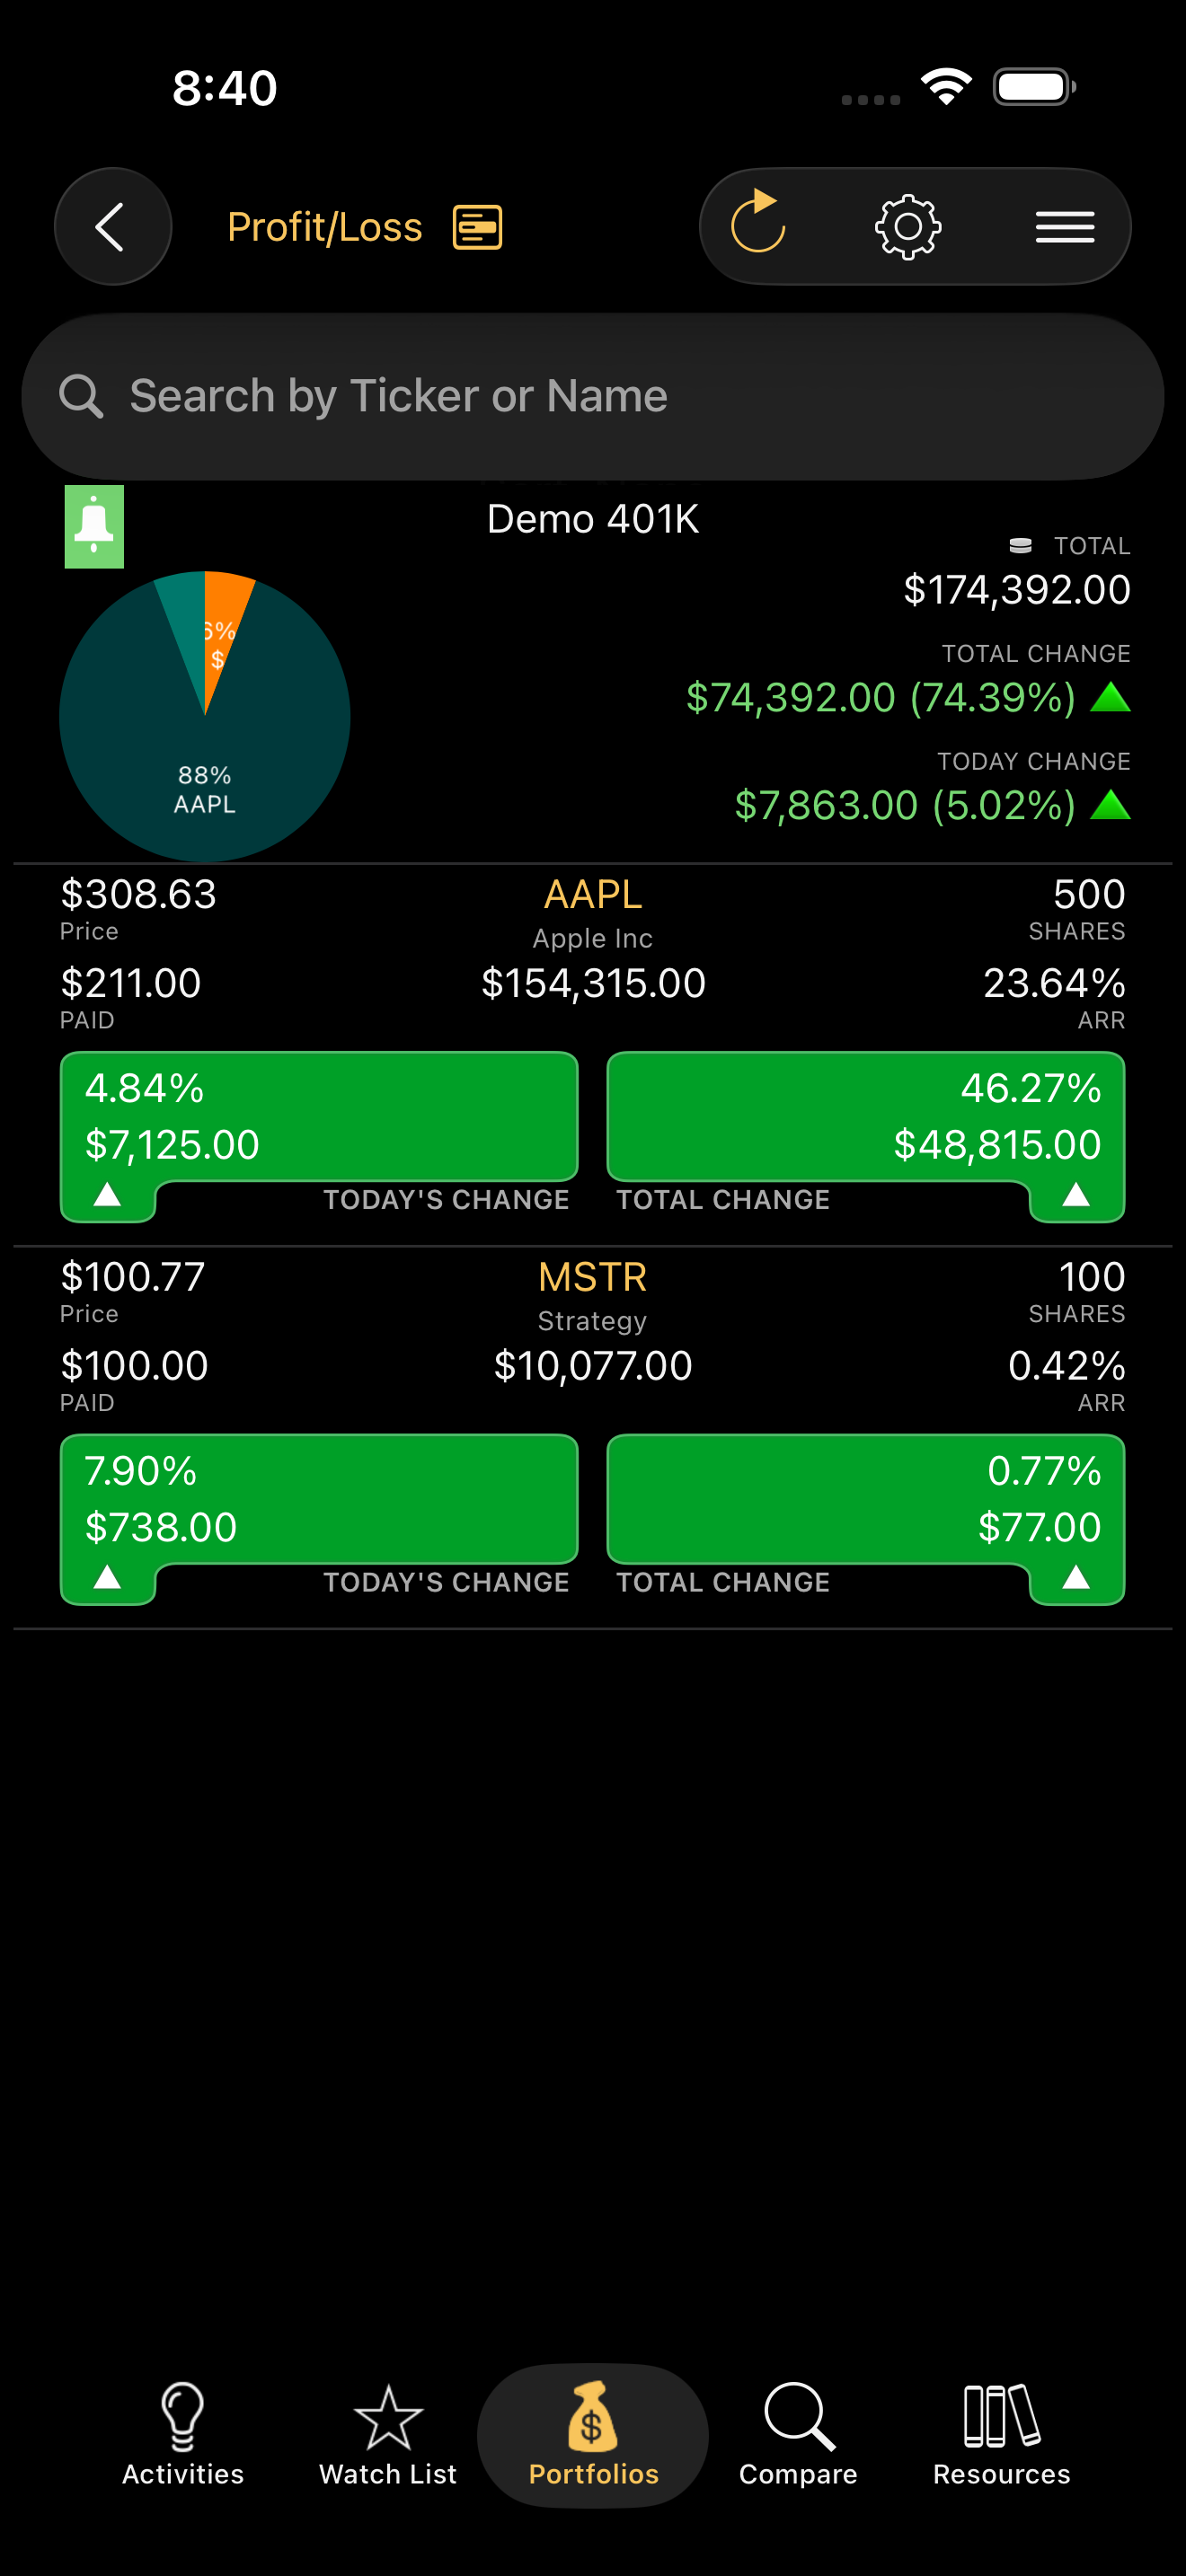
Full profit and loss breakdown per position, total portfolio value in real time, and allocation charts that show exactly where your money is working.
See projected dividend payouts for the next 12 months, with average monthly income and a full calendar breakdown by company or month.
Join thousands of investors who rely on Stocks Live every day to research, track, and grow their portfolios.
Real-time quotes across US, international and crypto markets — bids, spreads, volume, 52-week ranges and market cap, always up to the second.
Yes — track as many portfolios as you like with real-time P&L, allocation pie charts, custom tags, and total values in any currency, all in one view.
It builds a 12-month dividend forecast from your actual holdings, with projected monthly payouts grouped by company or date — your passive-income plan at a glance.
A color-coded grid of the entire market: spot sector movers, identify trends and find opportunities in seconds.
Over 1,000 scanners covering bullish and bearish patterns across technical and fundamental indicators, in all markets.
iPhone and iPad on the App Store — with Apple Watch support, widgets and Siri — and Android on Google Play.
Since 2012 — over a decade of serving serious investors, with a 4.8 App Store rating.